Navigate the unseen.
The dust monitoring platform built for production engineers. Maps, trends, alerts, and exports — fed by live data from every sensor on your site, with no data lock-in and an open API.
- 15 s
- Update interval
- 99.997 %
- Platform uptime
- ±15 %
- PM accuracy, in-field
"Arpuro is a game-changer for our HSE monitoring. The system is easy to install, user-friendly, and requires minimal maintenance. It guides us to make the right decisions regarding dust reduction and detecting airborne dust leakages"

You can't improve what you can't see.
Dust levels change every minute — but what caused it? Did you change raw materials? Did your ventilation upgrade actually help? Are some zones consistently worse than others? Without the ability to drill into events, compare locations, and see long-term trends, you're left guessing. Arpuro turns continuous sensor data into the answers production engineers, HSE managers, and process owners actually need.
- 01How long can my team work in zone 4 today?
- 02Did the new hood reduce respirable dust at the tap?
- 03Why did Tuesday's afternoon shift spike?
- 04Are we trending up or down quarter-over-quarter?
See more. Know more. Act faster.
Built around the questions production engineers actually ask.
Real-time map
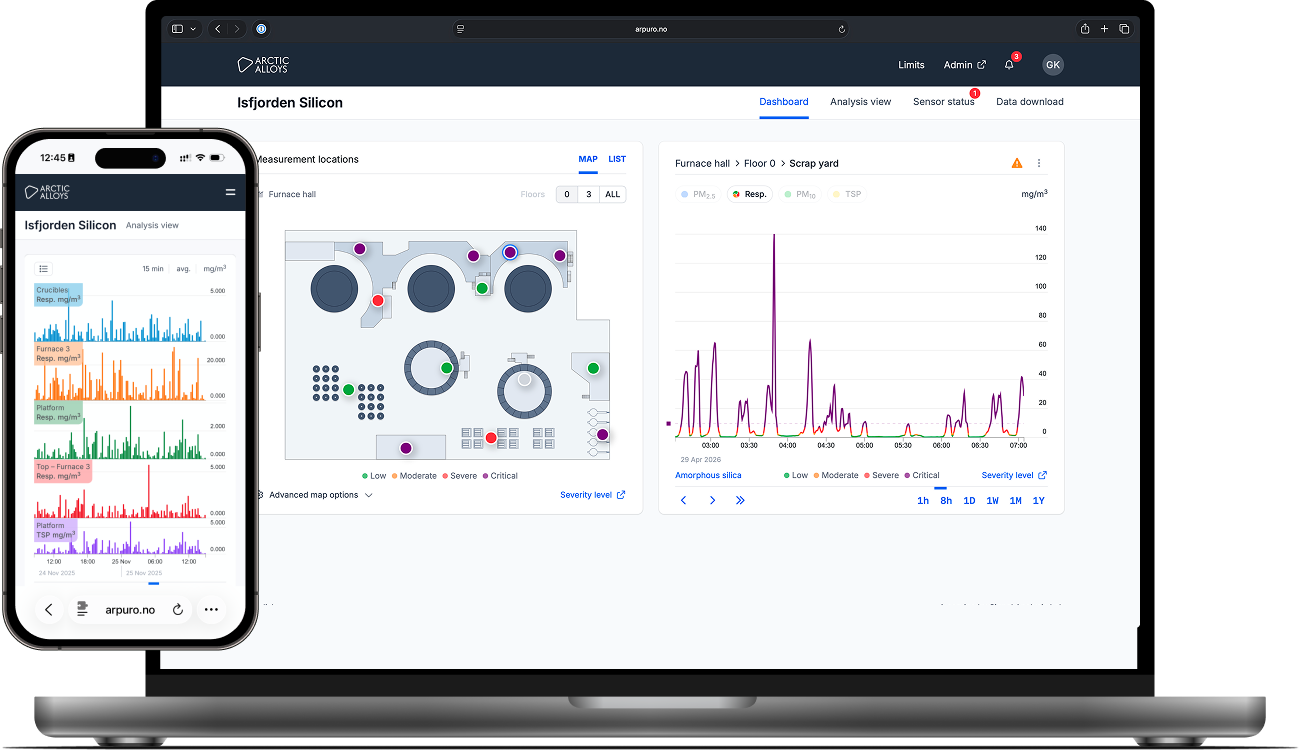
See where levels are dangerous, instantly. Everyone on site looking at the same picture from any device.
Fast zooming
Drill into events to see exactly what caused a spike — and how fast your ventilation removed it.
Long-term trends
Zoom out for the big picture. How effective was your dust initiative in February? The data tells you.
Advanced analytics
Compare locations, time periods, and dust composition. All in one view. No Excel exports needed.
Mobile and Email alerts
Push notifications when thresholds are crossed. Stay informed; act fast.
Sensor health dashboard
Every sensor, one dashboard. Status, last reading, calibration date.
Easy data export
Excel, CSV, or JSON in one click. Your data, your way.
Open API integration
PowerBI, Grafana, your own systems — all supported. No data lock-in.
The infrastructure you need — already in place.
The unglamorous parts that have to work before any of the visible features matter. They do.
- 99.997% uptime
- Mobile + desktop responsive
- Open API for integration (PowerBI, operational data)
- No data lock-in
- Real-time data
- EU data residency
Ready to see it?
30 minutes with one of our engineers and live data from a working plant. No slide deck.