Stop sampling.
Start monitoring.
Gravimetric sampling tells you what your workers breathed last quarter. Arpuro tells you what they're breathing now, at every furnace and on every shift. You see an exposure event while it is happening, not three weeks later in a lab report.
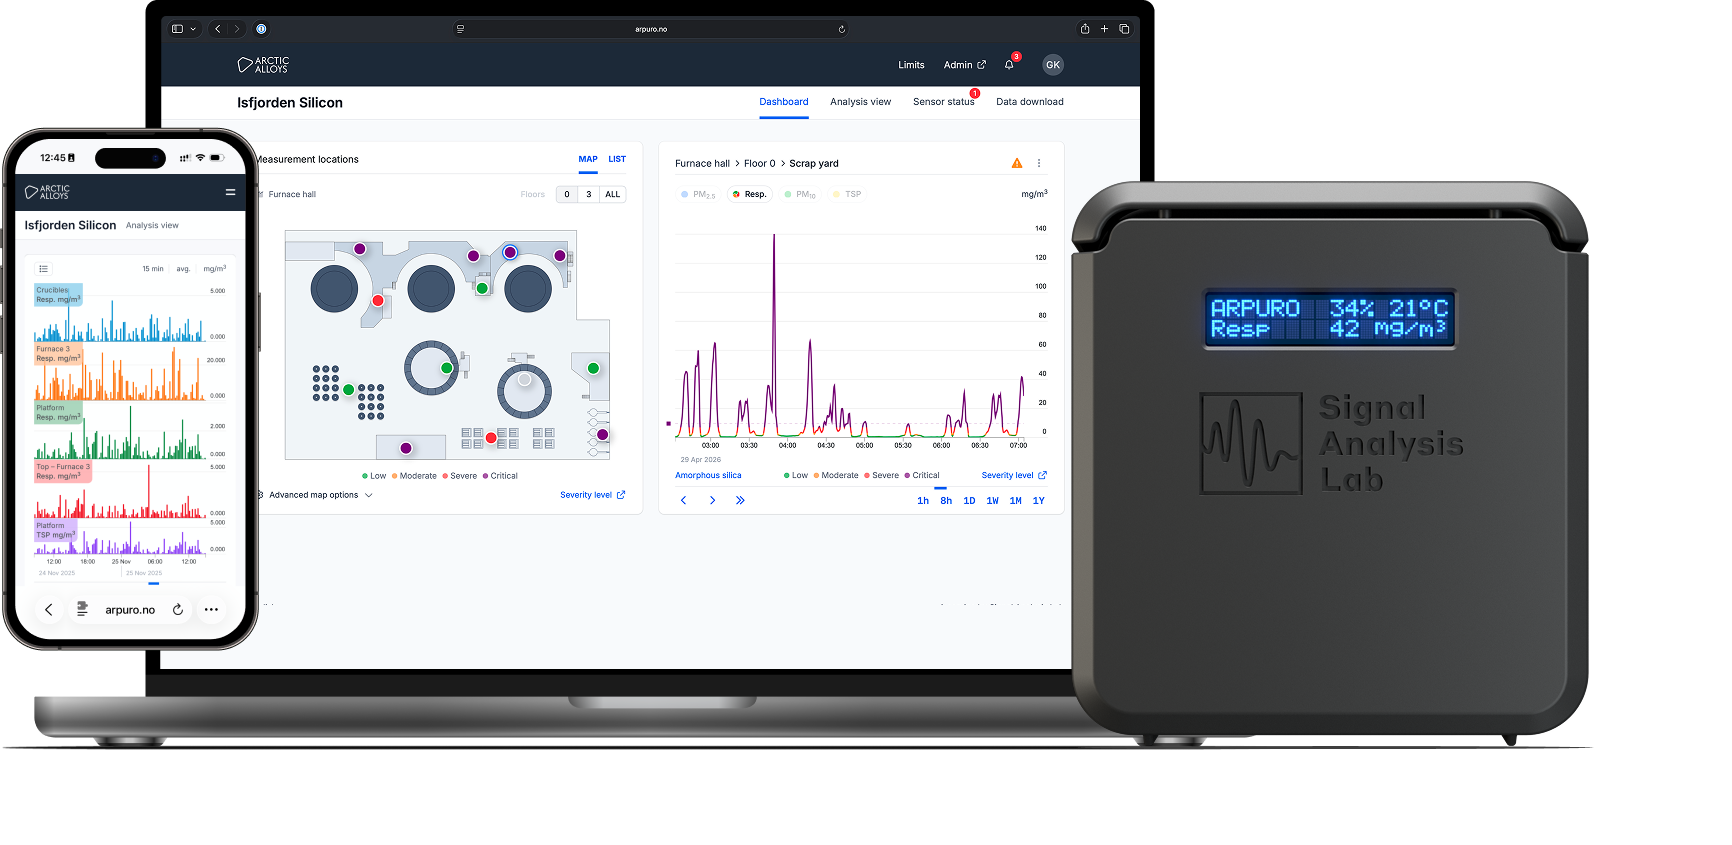
Floor plan · live readings · time-series
Measuring by lunch
on the day it arrives.
The sensor doesn't touch your network and needs no cabling beyond power. There are three steps, and the longest one is the courier.
A sensor lands at your site.
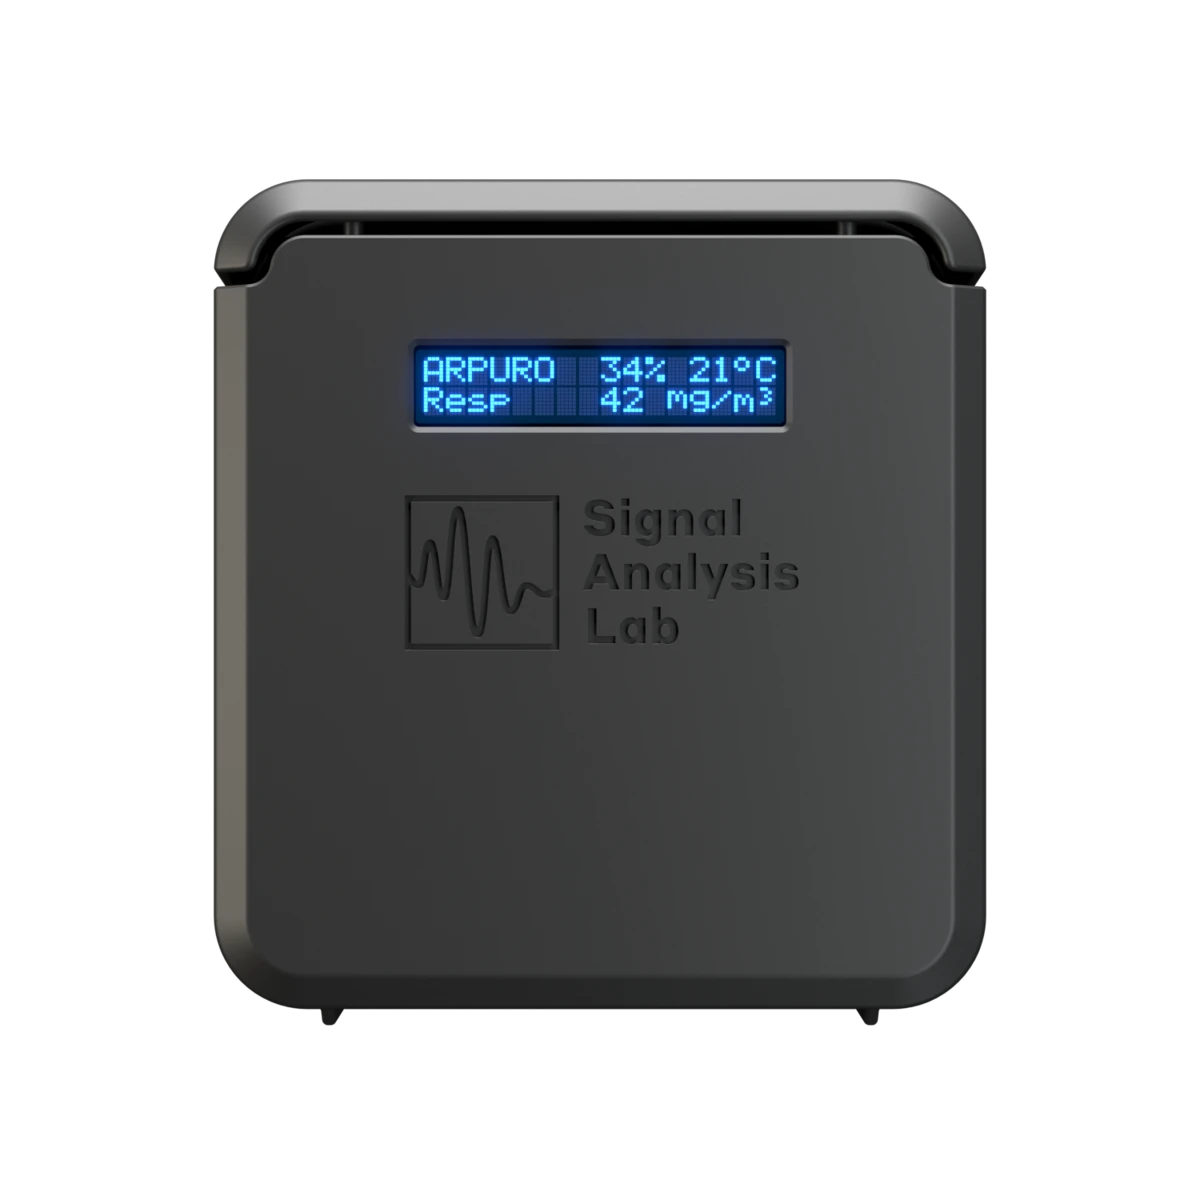
A 14×15 cm enclosure, calibrated at the factory and ready to mount. Field calibration is optional. When we recalibrate, the new constants are applied to every reading back to installation, so historical data stays accurate.
Two screws and a power lead.
Mounting takes less than 20 minutes. Switch it on and the sensor connects to our cloud over 4G. Nothing goes through your network, so IT has nothing to configure.
Live data on every phone.
HSE gets push alerts when limits are crossed. Workers see exposure before entering. Automated reports that complement your accredited gravimetric measurement program.
Designed together with the plants that use it.
Made to be repaired rather than thrown away.
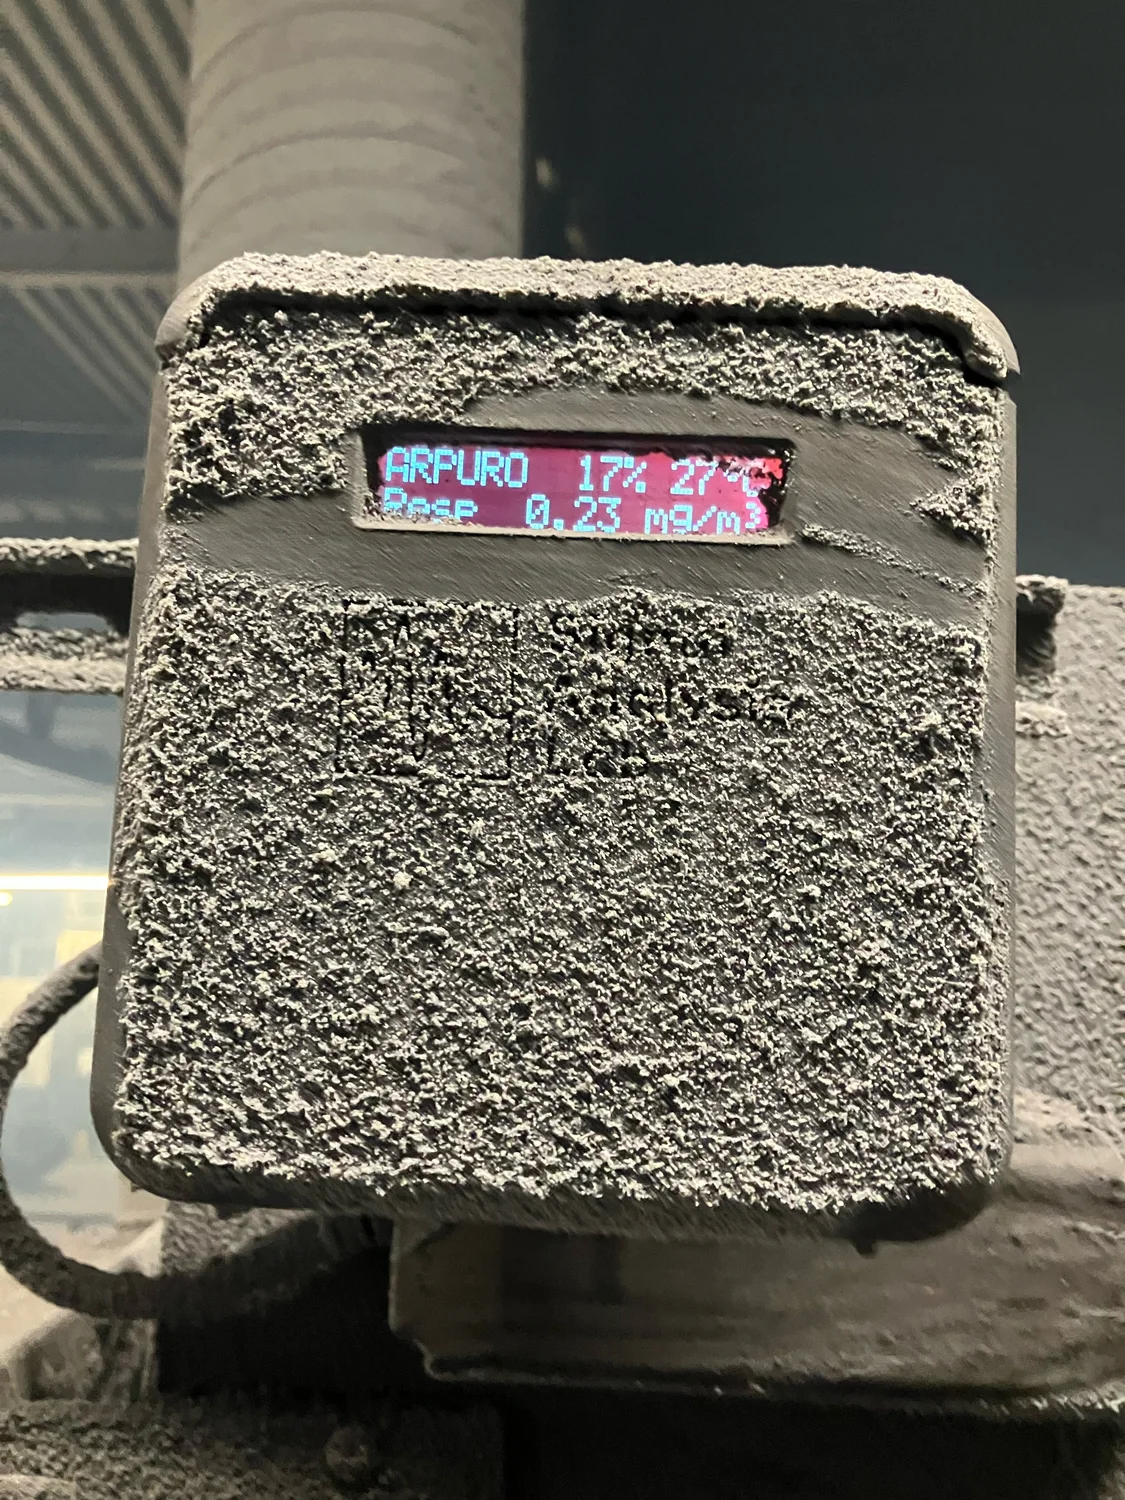
The inlet cleans itself, so the sensor keeps sampling.
Made for heavy dust loads.
Office sensors top out around 10 mg/m³ and rely on manual cleaning. Industrial dust needs headroom up to 1,000 mg/m³ and optics that stay clean on their own.
We calibrate the location, not just the sensor.
Most dust monitors are factory-calibrated against ISO 12103-1 A2 — better known as Arizona road dust. The moment your dust isn't Arizona road dust, the readings drift. So we do it differently. Then a customer checked our work.
The method
- 01 — Calibrated to your actual dust
- A reference sensor measures the real dust at each location and stores a correction coefficient for that spot. Silica fume isn't road dust. Cement isn't slag. Each location learns its own correction.
- 02 — Swap sensors freely
- The calibration belongs to the location, not the hardware. A replacement sensor inherits the constants on day one — no re-commissioning, no per-device offsets, no field engineer.
- 03 — Drift-corrected, retroactively
- When we recalibrate, every reading back to installation gets the new constants too. Historical data stays accurate.
Independently validated
Linearity across 0.4–27 mg/m³. Eight reference samples at three locations. Six months after install, no maintenance.
- Uncertainty
- ±14%
- Drift in 6 months
- None
- vs. accredited lab
- p > 0.05
Patent pending — PCT/EP2025/052264 →
Independent customer validation · Lab analysis by Nemko Norlab (accredited lab, Test 032 →)
From dust event
to auditor-ready report.
Pull the data over the API, download it from the portal, or ask for it in plain language.
Site-aware by default
Each location carries its own calibration coefficients and OEL limits. Move a sensor between floors and Arpuro recalibrates automatically — no engineer visit, no spreadsheet to update.
Plain-language access
Ask "show me the worst locations at Holla last month" — get a ranked table, charts, and a written summary. No coding, no dashboards to configure. The MCP server is in production today.
Open data, open reports
Word and Excel reports modelled on the format an ISO 17025-accredited lab would issue, with values mapped to your local OEL framework. Or pull raw measurements over the REST API. You can export all of your data at any time.
Installed where the dust is worst.
Ferro-alloy plants in Norway, silicon furnaces in Iceland and quartzite mines in Spain. These are the places where dust is hardest to measure.
Continuous measurement of dust concentration at our plants is a major leap forward. I've wanted this for many years — until now, we lacked the solution.

- 41%of Norwegian ferro-alloy production(by tonnage)
- 15%of European silicon-alloy smelting industry
- ~1%of global ferro-alloy production
- 20 sites
- 13 customers
- 3 countries
- World's largest quartzite mine
- World's #1 & #2 silicon furnaces
From the team behind Signal Analysis Lab.
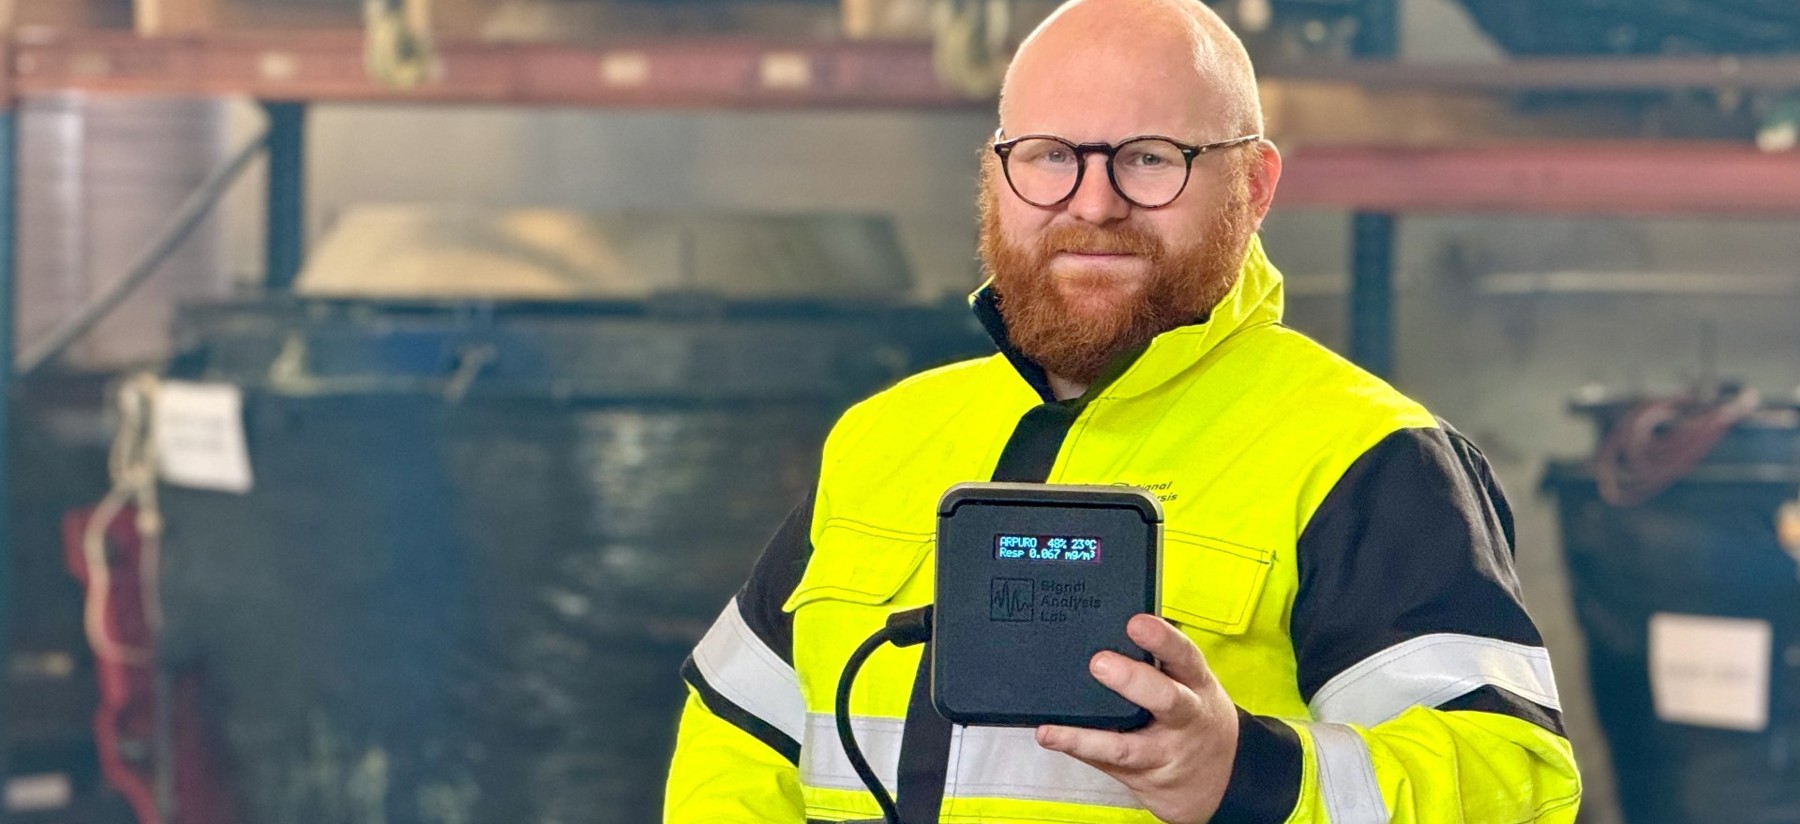
Arpuro Labs is 100% employee-owned by the engineers behind Signal Analysis Lab — focused entirely on industrial dust monitoring.
About usMeasurement-as-a-Service.
Hardware, hosting, replacements, support and platform — bundled. OPEX, predictable, scales with your site count. Start with one sensor, expand when the data makes the case.
- Hardware included — no upfront CAPEX
- Sensor replacements per estimated MTBF*
- Unlimited platform users · API access
- Setup consultation — we tell you where to mount it
* Terms apply
Need outright purchase or non-standard calibration? Talk to us.
Made for heavy industry.
Metallurgy
Foundry fumes, slag handling, electrode dust around the furnace floor.
Mining & tunnels
Quartz dust in open-pit and underground operations, drill-and-blast cycles.
Cement
Kiln dust, raw material crushing, clinker handling and silo loading.
Energy
Coal handling, biomass conveyors, fly-ash and electrostatic precipitator zones.
Construction
Demolition silica, earthworks dust, concrete cutting and tunnelling fines.
Food & grains
Flour, sugar, grain silo dust — combustible atmospheres requiring active monitoring.
Notes from the field.
Calibration research, case studies, and field notes from the engineers building the product. Written for the people running the plants.
Read the blog Find your worst
dust hotspot — 30-day trial.
Pick one production line. We'll send a sensor and set up a 30-day monitored trial. The data from the trial becomes the business case for full coverage.
- Reply within one business day
- Reply in 11 languages — pick yours above
- Your data stays with us — never sold or shared